

As the DFS (daily fantasy) landscape sprawls at an accelerated pace, the competition continues to grow sharper, and smarter. Everyone is looking for that next edge, the secret sauce, the workaround that separates the weekend warriors from the high-stakes grinders.
What are we to do? Should we rely on gut feelings? Twitter hot takes? Nah fam. We decided to roll up our sleeves, and get our hands dirty as we dig deep into the abyss that is DFS Data. We have sifted through volumes of statistics, trends and the beating hearts that comprise each and every NFL Sunday main slate to figure out what ACTUALLY correlates with winning scores. What we emerged with was enough to develop what we call the Fantasy Impact Index – a black belt in DFS scouting, a data driven weapon to help you sift through the chaos.
Think of the Impact Index (and check it out here to use it yourself) like your fantasy GPS – a single score from 0 – 80 (with bonus points and weights on top of that) that weighs factors proven to be predictive of DFS success. We compiled the best nuggets of wisdom – volume, efficiency, opportunity, game environment, salary constraints, and sprinkled in some spicy bonus points for indicators like Tru QBR, or red-zone work to name a couple.
There is no corner cutting here either. What we have developed is a uniform scale across QB, RB, WR, and TE that will help you determine at a glance who is really cooking, and who’s just blowing smoke. No, it’s not going to guarantee that you win the Milly Maker each week. If I had something that good we would all be living in penthouses in Vegas by now. But it is your best bet to cut through the noise and play with a scientific edge.
Quarterbacks: High Game Totals And Efficiency Reign Supreme
Forget chuck – it – all volume, what really moves the DFS needle for the QB position are efficient home favorites, in high game totals. Salary is a big indicator as well, and if you are adding QBs with salaries over $8,000 on DraftKings, or $9,000 on FanDuel, you better be planning on ceiling performances for them, because they just don’t typically show up in the winning lineups.
Not all of these data points are equal indicators though. For instance, favorite status does correlate to DFS success, but it isn’t always necessary, especially in games with high totals. It makes sense that a quarterback in a shootout would typically have a greater chance at hitting his ceiling than one riding a slow burn who hands it off all fourth quarter as the teams coasts to a victory. Quarterbacks at home get yet another bump.
Finally the Index applies weighted bonuses to QBs with 100+ Tru QBR, as well as those with high expected yard totals, and rushing floors. When you have a QB with a rushing floor worth 3 or 4 points, the 300 yard bonus isn’t as big of an edge, if any.
Running Backs: Volume Is King
Our backtesting confirms what the old timers always told us, touches matter. The data tell us that 18 touches per game is the baseline, 24 + is ideal. While volume is king, the quality of those touches matters as well. 18 + touches behind a crappy line isn’t the same as 18 + behind a competent one. Speaking of all touches not being the same, Red Zone chances are incredibly predictive, especially on FanDuel where tuddys are weighed a bit heavier.
Those precious carries inside the 10 and 5 yard lines are the ones that fatten scores, and wallets. There is nothing more frustrating than your RB rushing for 100 yards, adding another 30 through the air, but failing to hit pay-dirt while being vultured by his backup, or worse…the QB you faded. DFS is a b***h sometimes.
Game environment, efficiency and salary are big indicators as well. Favorites in high scoring games are the most predictive. We all know just how money it is to watch your RB up by multiple scores in the 4th quarter just milking the clock. The Index also considers efficiency metrics, but we didn’t get too fancy here, volume is the key. Salary is another big one. Guys with tags over $8,000 on DK or $9,000 on FD are just priced out of being optimal in most cases.
Wide Receivers: Targets, Targets, And Oh Yeah, Did I Mention Targets
The data is clear here, target volume is the most predictive data point for DFS WRs. This obviously makes sense, as the fantasy elite are practically magnetized to the football. The threshold for some juicy fantasy goodness is 7+ targets.
It’s not very complicated, more chaces means more catches, more catches means more points, yards, touchdowns, and dead presidents. It is equally true for WRs that all chances are not created equally though. Red zone targets turbocharge WR upside. Wide outs who command 25% or more of their teams red zone targets account for more TDs. You want those. So the Index weighs it accordingly.
WRs are not too worried about whether they are home or away, but the script is very predictive of fantasy goodness. Not surprisingly WRs on teams with high totals are the first place we look. What may surpise you though is that underdogs, with totals under 21 points also seer a pretty significant garbage time bump.
The backtesting tells us this is almost as predictive as a favorite with a high total. So if you’re sweating a game where your receiver is down big in the second half, you still have a vey good chance at hitting fantasy while your WR is busy practicing his endzone dance for next week. Each week the WR position is a crap- shoot, but sticky indicators like target volume, game script, and salary can help us sidestep potential landmines. Sometimes, thats just as important as having the stud who breaks the slate.
Tight Ends : A Niche Position Is Becoming A Positional Advantage
So many times last season, my bankroll lived or died with the performance of the TEs in my DFS lineups. Again volume and red zone work are the key, but backtesting shows us that tight game environments are highly predictive as well. The Index favors TEs in games with < 7 point spread. We also prioritize TEs with salaries between $3,000 – $5,000 on DraftKings and $4,000 – $6,000 on FanDuel. The high priced guys just dont cut it at a position that can be pretty barren on a week – to – week basis.
Home field advantage and favorite team status do add some value here as well, but its subsidiary to the others, and is more of a polite nod than an actual driver of fantasy goodness at the position. As such, those data points are weighed less heavily. Like WRs, garbage time points help as well, so we look for dogs under 24 total points (18 seems to be the number).
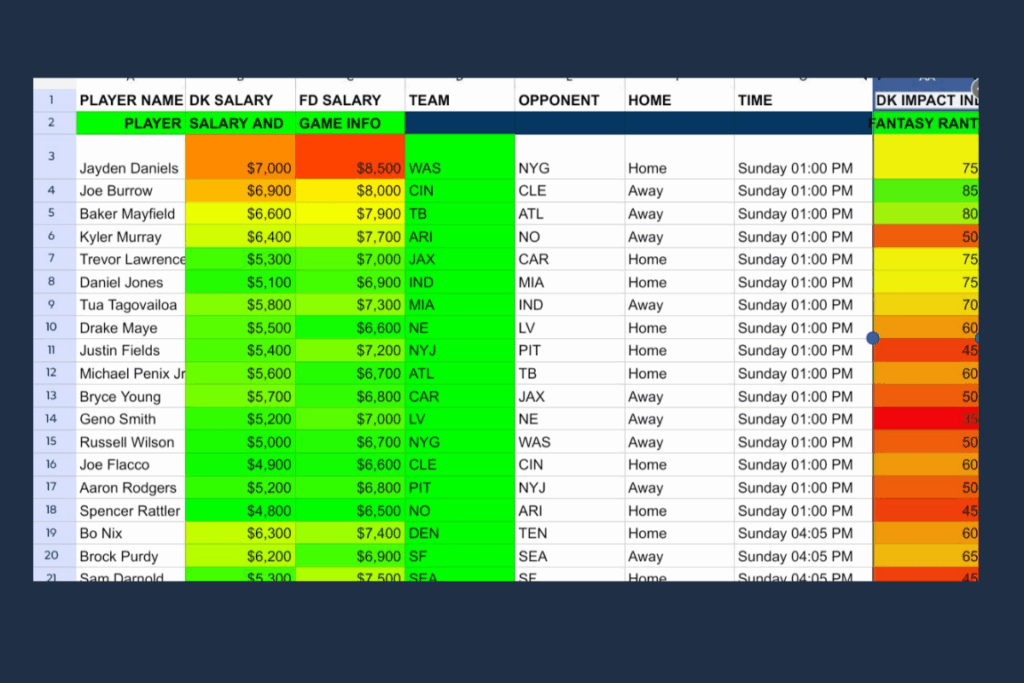
Okay, so we have this shiny new toy, what the hell do we do with it? Glad you asked. And once again, you can access your shiny new toy for free right here.
The Index is going to be a lifesaver for those of us who like to hand-build our DFS lineups. Whether you are grinding cash games, entering small fields tournaments, our busting heads in single entry contests, the Index is built to help you quickly zero in on high-floor, “safe” plays across all salary levels. No more scrolling for that $6,200 dollar RB who you seem to remember has done it before….maybe.
Where the Index really shines though is when you combine it with Fantasy Rant’s projected points and ownership percentages. Imagine seeing a chalky player, trending up all the touts boards all week, and then the Index flips over a 35. You can now fade with confidence (the exception here will be backup players who just dont have much data to weigh historically. Obviously they will have low Index scores, but could still be very good plays).
What about for those of us who build 150-200 lineups a week. My Sunday co-host Hardy builds 300-400 lineups a week. Thats just crazy, and I don’t mean crazy like that girl that rocked your world freshman year of college. I mean like people who bite their own toenails kind of crazy. Fortunately the Index is quite useful in this process as well by helping you build a core of high floor/ upside plays, while also highlighting low owned home-run hitters. Imagine seeing the Index flip you an 85 and ownership is under 5%. Thats like having pocket aces, and getting raised by J – 7.
The Index is more than a cheat sheet, its a strategic partner helping you make sense of copious amounts of (overwhelming at times) information at your disposal. I will never suggest that you stop finding ways to synthesize your data into actionable information, but at least let the index help you, lest you end up like Charlie Kelly in the mail room.

For more daily fantasy content check out Fantasy Rant on Instagram, or Youtube. Or check out TJ Geraghty for your fill of year long fantasy football league content. So from all of us here at Fantasy Rant and Stadium Rant, we wish you the best of luck Week 1, and beyond, and we hope to meet you at the top of the leaderboards!
