

For the audio version of this article, CLICK HERE
Baseball stats are interesting because some of them are straightforward, and others are a bit convoluted. Stadium Rant recently released a pair of articles pushing a stat created here called WHERIP. This would be walks+hits+earned runs allowed per inning pitched. It’s designed to determine how good a pitcher is without giving them credit for wins or strikeouts. Basically, the less damage a pitcher does to his team each inning, the better he is.
The statistic determined that the greatest pitcher of all time (live ball era only) was Clayton Kershaw, and the greatest right-handed pitcher of all time was Jacob DeGrom (no minimum innings pitched). It has come under fire by the baseball community on social media, being called a fake or made-up stat. What these supposedly baseball purists are ignoring is that all of baseball’s stats are fake or made up.
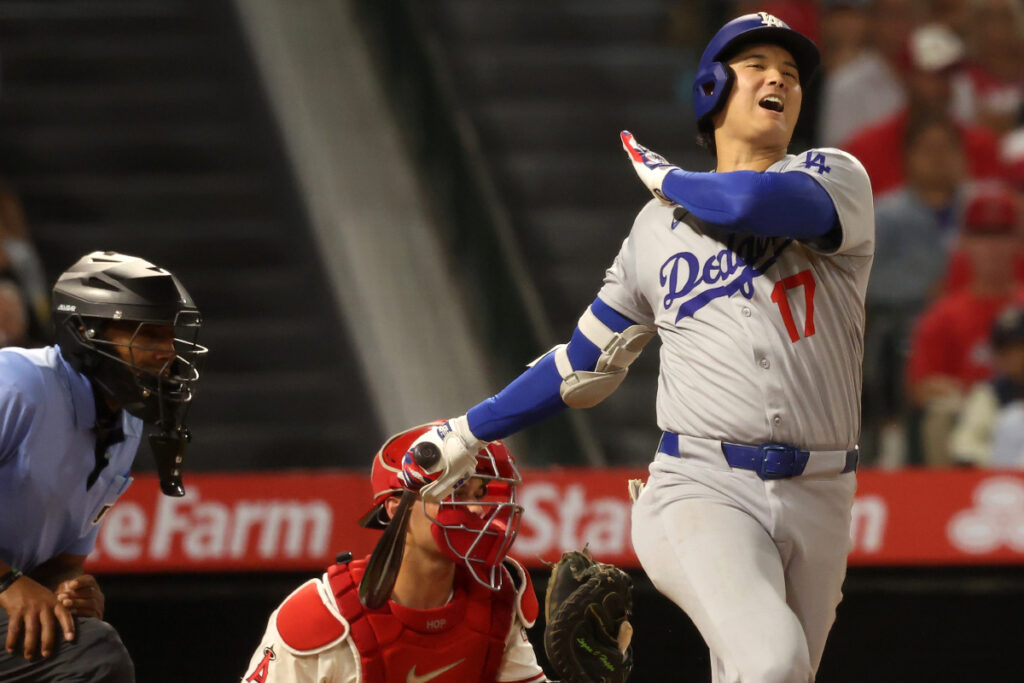
Batting average seems like it would be the most direct statistic, representing a percentage of times a batter gets a hit versus the number of their at-bats. A player who gets two hits in four at-bats has a .500 batting average (or gets a hit in 50% of their at-bats). What muddies the water for this particular measurement is the definition of an at-bat. It’s not counted as the number of times a player faces a pitcher (that’s a plate appearance), and sometimes the player hits the ball into an out, and because of that, doesn’t get credit for the at-bat.
If a player hits a pop fly to right field, and it’s caught, rendering that player out, he is 0 for 1 (he had one at bat, and he didn’t secure a hit). Contrary to that, though, is if there was a teammate of the hitter on third base and he scores on that fly ball out. In that scenario, the hitter never had an at-bat but managed a run batted in (RBI). If the player is walked on four balls, he goes to first base without ever having an at-bat, and if the bases are loaded, he is credited with a run batted in.
To account for walks, baseball invented another stat, on-base percentage (OBP). If a player goes 1-2 with two walks, their batting average will be .500, but their OBP will be .750 because they reached base on 75% of their plate appearances. If this is not confusing enough, wait until errors are brought into the equation. If a player hits a ground ball to the shortstop, who bobbles the ball and throws to first late, the runner (former batter) is considered safe. In terms of batting average and on-base percentage, he is considered out, though. This is because he should have been out, and baseball stats believe that if something should have happened, then it actually happened, even when it didn’t happen.
The same is true for a fielder’s choice. If there is a man on first base, and the hitter grounds to third, and instead of throwing the batter out at first, the third baseman throws out the runner at second base, then the hitter is considered out in terms of hitting stats, since the fielder could have thrown him out but chose not to. Considering all that has been mentioned, a hitter could reach base safely four times in a game, and be considered 0-4 hitting and 0-4 in terms of getting on base.
Slugging percentage is a great example of statisticians creating a stat out of nowhere to demonstrate an ability, in this case, power hitting. Slugging percentage divides the total number of bases a player got for a hit by his number of at-bats. If he hits a homerun in his first at-bat, he has a slugging percentage of 4.000 (4 bases on the hit divided by 1 at-bat). The idea is that the more bases a player gets per hit, the more of a big hitter he is, but that’s not entirely true. In 1994, Tony Gwynn (one of the greatest contact hitters of all time) had a slugging percentage of .568, even though he only had 12 home runs that year.
Jose Canseco in 1994 hit 31 home runs for the Texas Rangers, and his slugging percentage was .552. He had fewer total bases per at-bat than Gwynn, despite being considered a better power hitter. Stats apparently aren’t an exact science. They can get crazy, though, and analytics people love to combine stats, which is where OPS comes from (on-base plus slugging). Simply adding a player’s on-base percentage to their slugging percentage gives an OPS total that is supposed to demonstrate how complete a hitter is (gets on base and hits for power).
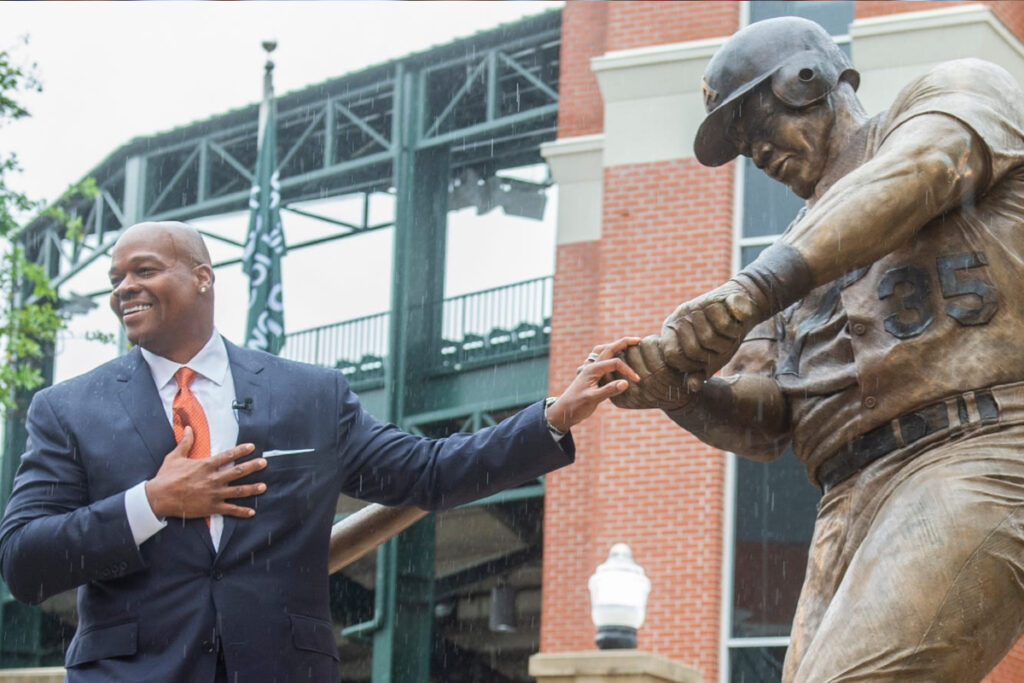
Since slugging percentage is flawed, so is OPS. Babe Ruth has the highest OPS in major league history (1.636), so the stat seems to have merit on the surface. Where it fails is that Mark McGwire has a better career OPS than Frank Thomas, who was a far more complete hitter. McGwire only hit over .300 once in a full season during his career, while Thomas did it nine times, including winning two batting titles. Thomas was also a great power hitter, he just never used steroids to hit 70 bombs in a season.
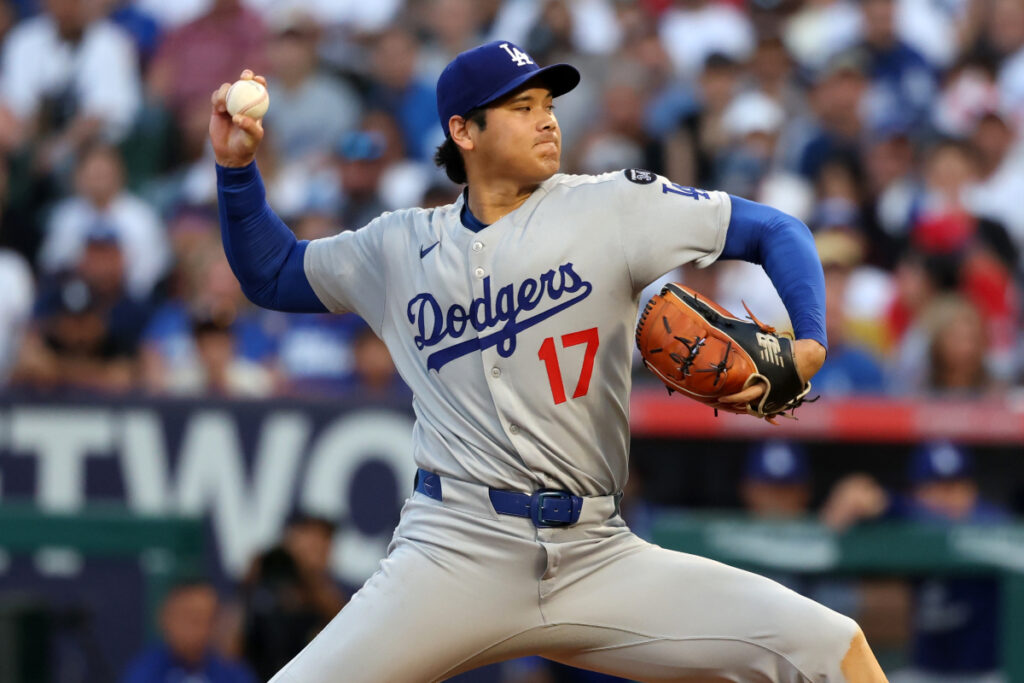
Wins should be straightforward for a pitcher, but they aren’t. A pitcher only gets the win if the team is winning before a relief pitcher is brought in, or if they pitch the complete game (a rarity these days) and the team wins. If a pitcher leaves the game in a 0-0 tie after seven innings pitched, and the reliever gives up two runs, but his team scores three runs in the bottom of the inning, the relief pitcher will likely get the win, despite pitching worse than the starter. If the starter leaves the game down 1-0, his reliever gives up five runs, and his team scores five runs, the starter, who pitched great for seven innings, gets the loss.
This is why ERA (earned run average) is important, though it’s also not without its confusion. For starters, ERA is not the number of earned runs a pitcher gives up per game, but the number of earned runs he gives up, multiplied by nine, and divided by innings pitched. Simple formula, right? So, if a pitcher gives a team nine innings and gives up three runs, does he have an ERA of 3.00? Not exactly.
Not all runs are earned runs. If two players get on base by way of an error and then the pitcher gives up a home run, even though it was a three-run homer, it only counts as one earned run, since the two runners were “not his fault”. Yes, in theory, a batter could drive in a run that the pitcher didn’t technically allow, despite not getting a hit.
Baseball also likes to track strikeouts per nine innings instead of strikeouts per game, but at least that is consistent with ERA. They must also track walks and hits a pitcher gives up per nine innings too. No, walks and hits given up are tracked by each inning, rather than by game or per nine innings.
At this point, you no doubt need an extra strength Excedrin for the migraine this article has given you. That’s to be expected. Only die-hard fans truly understand the stats and believe they make sense in some way. What’s ironic is that the same fans who value ERA and think OPS is a real thing are the same people putting down WHERIP. This stat is really just pitching’s version of OPS, but unlike that nonsense, it is far more accurate. When considering the absurdity of existing baseball stats, how can anyone say that a new stat is “stupid”, regardless of where it came from?
